


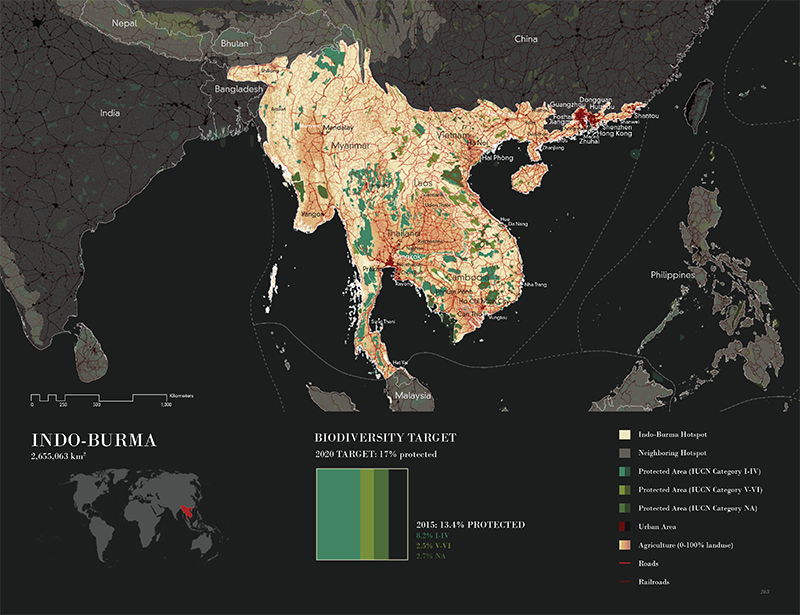
Hotspot Map example. The hotspot maps show protected areas (as of 2015) broken into three broad groups based on their primary management objectives as classified by the IUCN: categories I-IV; categories V-VI; and NA. The categories range from strictly protected nature reserves, wildlands and parks (I-IV) to areas of more lenient management with the potential for development and the sustainable use of natural resources (V-VI). Representing roughly 35% of the number of global protected areas tabulated, the NA category does not denote lax management policy, simply areas that for one reason or another have not adapted the IUCN management classification system.
In a forum on global urbanization, biodiversity and policy held at the University of Pennsylvania School of Design yesterday Earth Day, Richard Weller,Martin and Margy Meyerson Chair of Urbanism and Professor and Chair of Landscape Architecture, presented the results of a 3-year research project entitled Atlas for the End of the World, which is published online at http://atlas-for-the-end-of-the-world.com. Hotspots are regions of the world recognized by the global scientific and conservation community as containing an exceptional and irreplaceable diversity of life that is threatened with extinction. When put together, the hotspots are the sum total of the world’s genetic inheritance. The loss of these landscapes, Penn’s Weller explains, would be “akin to bulldozing the world’s libraries and burning all the books.”
The Atlas is a collection of hundreds of maps which cover 2 critically important subjects: 1) how the world’s 36 biodiversity hotspots are performing in regard to meeting 2020 United Nations conservation (protected area) targets and 2) which cities in the hotspots are growing and are on a collision course with endangered species. A key finding of the Atlas is that currently only 14 of the world’s 36 hotspots have achieved the UN target of 17% protected area. In order to reach the target, the equivalent of almost 700,000 New York Central Parks will need to be legally secured in the next 3 years. The purpose of the Atlas is to help determine where, from a global land policy and development perspective, this additional protected area could be allocated.
The challenge for governments seeking to meet the UN targets is that it is not enough to make more protected areas in the hotspots that currently have shortfalls. It is also necessary for protected areas to be connected together into larger landscape matrices so that species can migrate and adjust to climate change. Forming such connectivity is very hard to achieve because it challenges existing land uses. With regard to the 422 main cities in the world’s hotspots, the Atlas concludes that 383 of them are sprawling directly into remnant habitat containing threatened species.
Furthermore, many of these cities do not appear to have urban planning strategies to avoid this calamity. Similarly, many of the nation’s presiding over the worlds hotspots don’t have national land use plans which seriously incorporate the long-term preservation of biodiversity. The Atlas is designed to help the global conservation movement to focus and prioritize its efforts. It is also meant to be a wakeup call to the design and planning professions. While the planning and design professions have done a good job of improving the livability of cities in developed parts of the world, they have been largely oblivious to much of the carnage that’s taking place elsewhere.
“If you really want to make a difference, this atlas shows you where to go,” he said.
And that’s exactly what he plans to do: Weller is asking foundations and NGOs to now fund a network of 36 demonstration projects, one in each of the world’s 36 hotspots.
Collaborating with Weller on the Atlas were PennDesign students Claire Hoch and Chieh Huang. http://www.penniur.upenn.edu/uploads/media/Weller_Atlas_PennIUR_Brief.final.pdf https://phys.org/news/2017-04-atlas-world-path-biodiversity.html http://atlas-for-the-end-of-the-world.com/


Recent Comments