

- A safer, more effective atrial fibrillation treatment method using magnetic gel may be on the way
- Self-repairing spacecraft could change future missions
- Injectable ‘satellite livers’ could offer an alternative to liver transplantation
- Next-generation memory material has the surprising property of shrinking when heated
APOGEE survey tagged posts
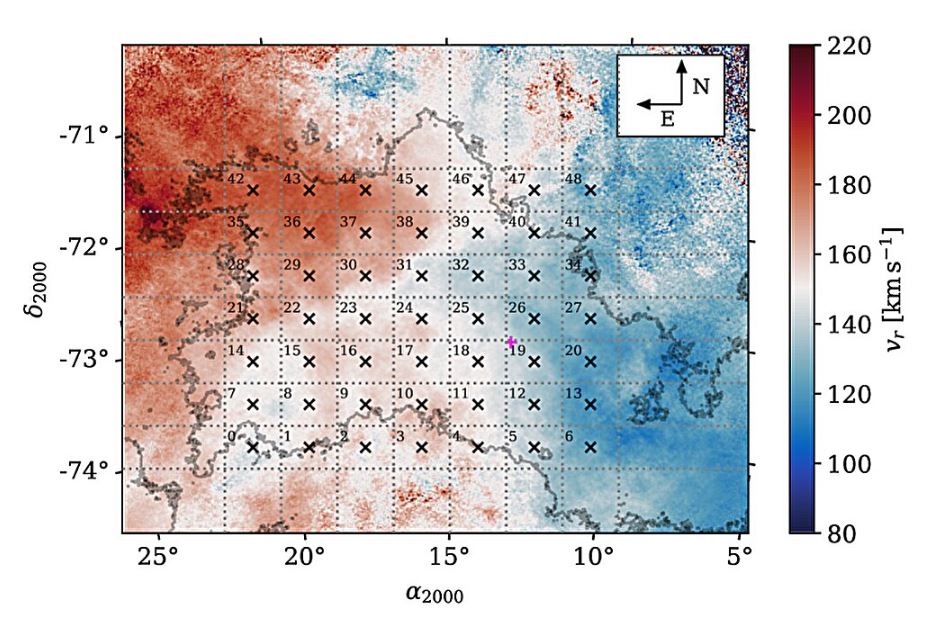
New study shows Small Magellanic Cloud is actually Two Smaller Galaxies
December 28, 2023,
 Astronomy/Space


Recent Comments