Calorie Restriction tagged posts

Mechanism Behind Calorie Restriction, Lengthened Lifespan Revealed

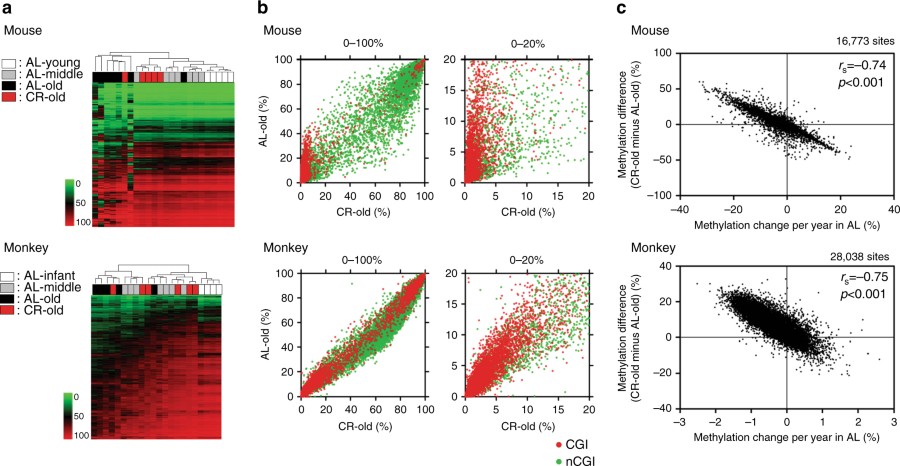
DREAM analysis in CR animals. a Unsupervised hierarchical clustering analysis of methylation values in all genomic regions. The green to red scale indicates the methylation percentage. The color codes for age and caloric status are shown on the left. b DNA methylation in AL old animals vs. CR old animals. Average DNA methylation level of each CpG site in CR old individuals (x axis), methylation in AL old individuals is shown on the y axis. The red and green dots represent CpG sites within CGI and non-CGI, respectively. The full range (0–100%) of methylation level is shown on the left and the low range (0–20%) is magnified and shown on the right. c Correlation between the effects of CR and age-related methylation drift in AL animals. The x axis shows methylation changes per year in AL-fed animals. Positive/negative value means methylation increase/decrease with age, respectively. The y axis shows the differences of methylation percentage between CR old and AL old animals. Each dot represents a CpG site. Spearman r values and the corresponding two-tailed p-values were calculated

DREAM analysis in CR animals. a Unsupervised hierarchical clustering analysis of methylation values in all genomic regions. The green to red scale indicates the methylation percentage. The color codes for age and caloric status are shown on the left. b DNA methylation in AL old animals vs. CR old animals. Average DNA methylation level of each CpG site in CR old individuals (x axis), methylation in AL old individuals is shown on the y axis. The red and green dots represent CpG sites within CGI and non-CGI, respectively. The full range (0–100%) of methylation level is shown on the left and the low range (0–20%) is magnified and shown on the right. c Correlation between the effects of CR and age-related methylation drift in AL animals...

Read More

Unraveling the functional diversity of Longevity gene SIRT1

Highlights •SIRT1-ΔE2 is a tissue-restricted splice variant of SIRT1 •SIRT1-FL/SIRT1-ΔE2 are indistinguishable vis-à-vis intrinsic catalytic activities •The conserved exon 2 (E2) domain may act to tether substrates •E2 encodes molecular specificity of interactions and functions

Highlights •SIRT1-ΔE2 is a tissue-restricted splice variant of SIRT1 •SIRT1-FL/SIRT1-ΔE2 are indistinguishable vis-à-vis intrinsic catalytic activities •The conserved exon 2 (E2) domain may act to tether substrates •E2 encodes molecular specificity of interactions and functions

Two alternate forms of SIRT1 leads to the discovery of how molecular specificity is encoded. While the search for elixir of life has captivated human imagination for millennia, researchers around the world have put in efforts to extend healthy lifespan and reduce the burden of morbid diseases in an increasingly aging population...

Read More