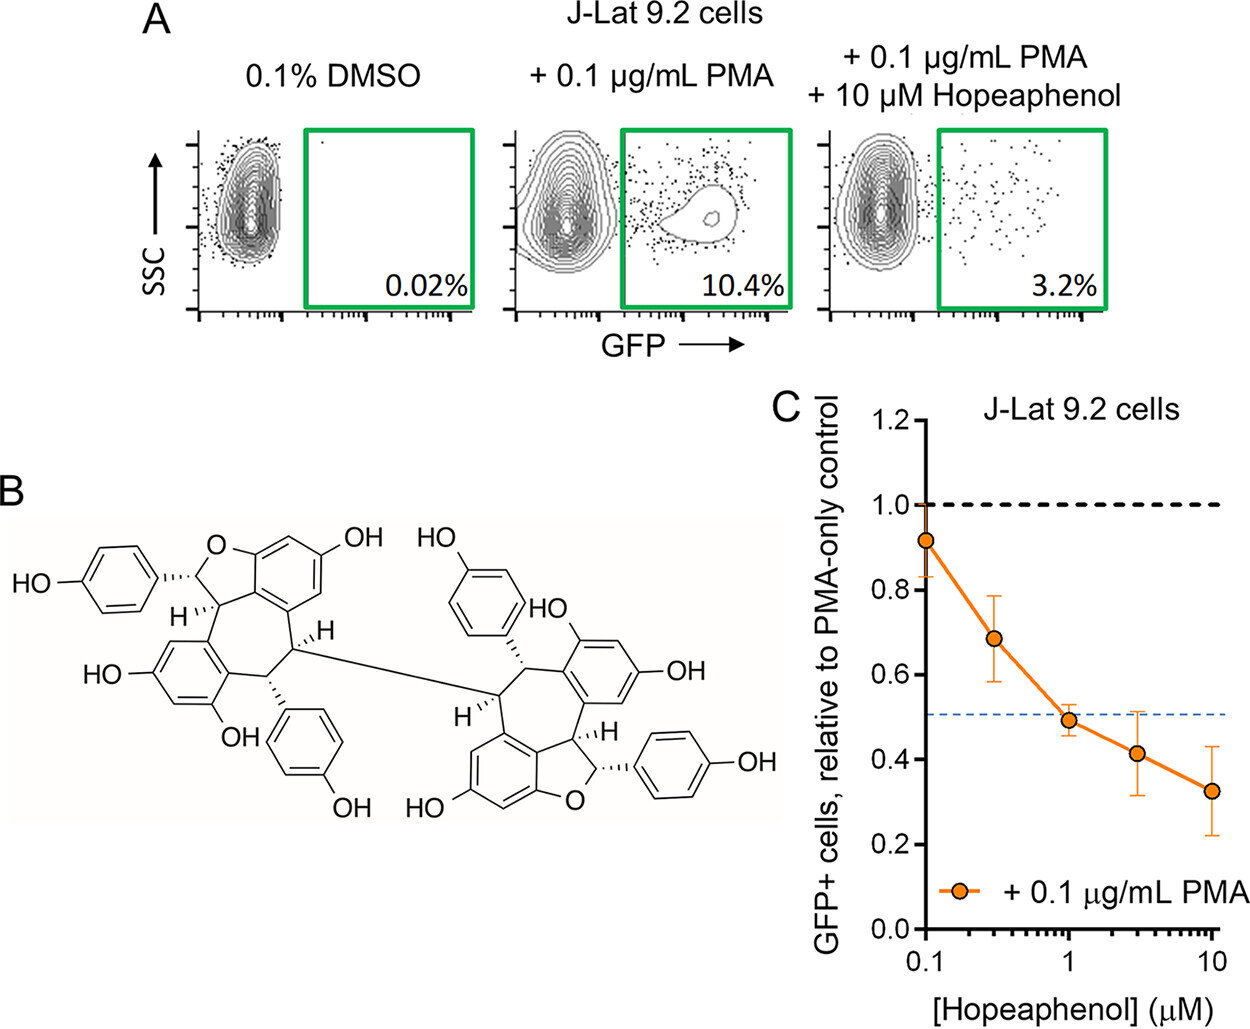
Overview of HIV inhibitor screening strategy and identification of (–)-hopeaphenol. (A) Representative flow cytometry examples of HIV-GFP reporter expression in unstimulated live J-Lat 9.2 cells treated with 0.1% DMSO control (left), live cells stimulated to express HIV-GFP by 0.1 μg/mL of the control latency-reversing agent PMA (center), and suppression of PMA-induced virus expression in live cells by 10 μM hopeaphenol (right); (B) chemical structure of (–)-hopeaphenol; (C) effects of hopeaphenol on PMA-induced HIV production in J-Lat 9.2 cells. Blue dotted line denotes half-maximal inhibition. In panel C, results denote the mean ± SD from three independent experiments. Credit: Antimicrobial Agents and Chemotherapy (2023). DOI: 10.1128/aac.01600-22


 Biology/Biotechnology, Health/Medical

Recent Comments