


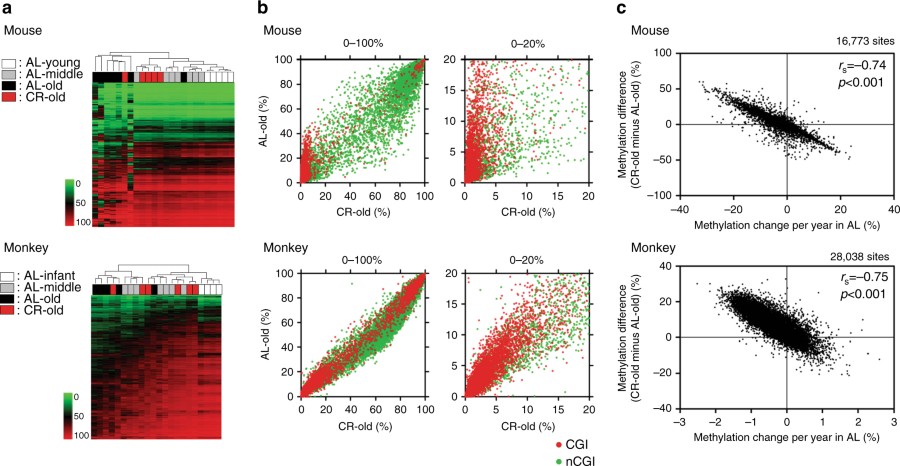
DREAM analysis in CR animals. a Unsupervised hierarchical clustering analysis of methylation values in all genomic regions. The green to red scale indicates the methylation percentage. The color codes for age and caloric status are shown on the left. b DNA methylation in AL old animals vs. CR old animals. Average DNA methylation level of each CpG site in CR old individuals (x axis), methylation in AL old individuals is shown on the y axis. The red and green dots represent CpG sites within CGI and non-CGI, respectively. The full range (0–100%) of methylation level is shown on the left and the low range (0–20%) is magnified and shown on the right. c Correlation between the effects of CR and age-related methylation drift in AL animals...


Recent Comments