Nobeyama 45-m Radio Telescope tagged posts

AI Draws Most Accurate Map of Star Birthplaces in the Galaxy

Osaka Metropolitan University scientists identified about 140,000 molecular clouds in the Milky Way Galaxy from large-scale data of carbon monoxide molecules, observed in detail by the Nobeyama 45-m radio telescope. Using AI, the researchers estimated the distance of each of these molecular clouds to determine their size and mass, successfully mapping the distribution of the molecular clouds in the Galaxy in the most detailed manner to date.

Stars are formed by molecular gas and dust coalescing in space. These molecular gases are so dilute and cold that they are invisible to the human eye, but they do emit faint radio waves that can be observed by radio telescopes.

Observing from Earth, a lot of matter lies ahead and behind these molecular clouds and these overlapping features m...

Read More

FUGIN Project: The most Detailed Radio Map of the Milky Way

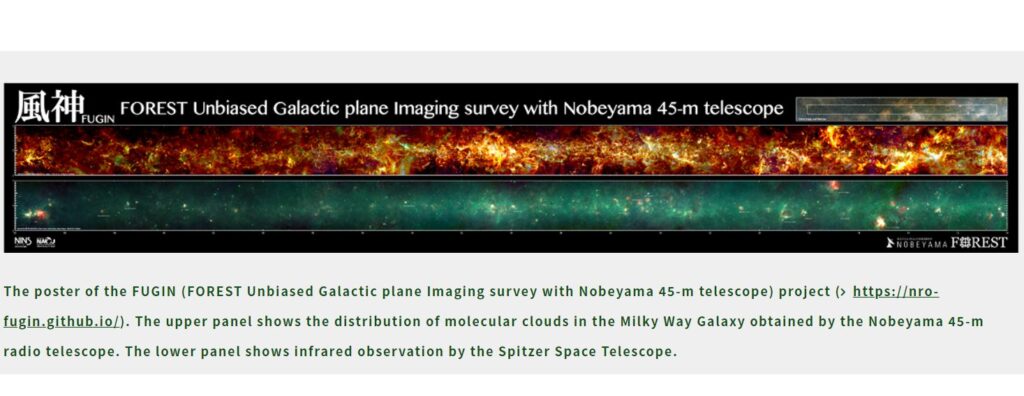
Radio map of the Milky Way obtained by FUGIN project. Top: Three color (false color) radio map of the Milky Way (l=10-50 deg) obtained by the FUGIN Project. Red, green, and blue represent the radio intensities of 12CO, 13CO, and C18O, respectively. Second Line: Infrared image of the same region obtained by the Spitzer Space Telescope. Red, green, and blue represent the intensities of 24μm, 8μm, and 5.8μm radio waves respectively. Top Zoom-In: Three color radio map of the Milky Way (l=12-22 deg) obtained by the FUGIN Project. The colors are the same as the top image. Lower-Left Zoom-In: Enlarged view of the W51 region. The colors are the same as the top image.Lower-Right Zoom-In: Enlarged view of the M17 region. The colors are the same as the top image.

Radio map of the Milky Way obtained by FUGIN project. Top: Three color (false color) radio map of the Milky Way (l=10-50 deg) obtained by the FUGIN Project. Red, green, and blue represent the radio intensities of 12CO, 13CO, and C18O, respectively. Second Line: Infrared image of the same region obtained by the Spitzer Space Telescope. Red, green, and blue represent the intensities of 24μm, 8μm, and 5.8μm radio waves respectively. Top Zoom-In: Three color radio map of the Milky Way (l=12-22 deg) obtained by the FUGIN Project. The colors are the same as the top image. Lower-Left Zoom-In: Enlarged view of the W51 region. The colors are the same as the top image.Lower-Right Zoom-In: Enlarged view of the M17 region. The colors are the same as the top image.

Astronomers have conducted a large...

Read More

Signs of 2nd Largest Black Hole in the Milky Way: Possible missing link in black hole evolution

Artist's impression of the clouds scattered by an intermediate mass black hole. Credit: Tomoharu Oka (Keio University)

Artist’s impression of the clouds scattered by an intermediate mass black hole. Credit: Tomoharu Oka (Keio University)

Nobeyama 45-m Radio Telescope data reveals signs of an invisible black hole with a mass of 100,000 times the mass of the Sun around the center of the Milky Way. The team assumes that this possible “intermediate mass” black hole is a key to understanding the birth of the supermassive black holes located in the centers of galaxies.

Prof Tomoharu Oka’s team has found an enigmatic gas cloud, called CO-0.40-0.22, only 200 light years away from the center of the Milky Way. What makes CO-0.40-0.22 unusual is its surprisingly wide velocity dispersion: the cloud contains gas with a very wide range of speeds...

Read More