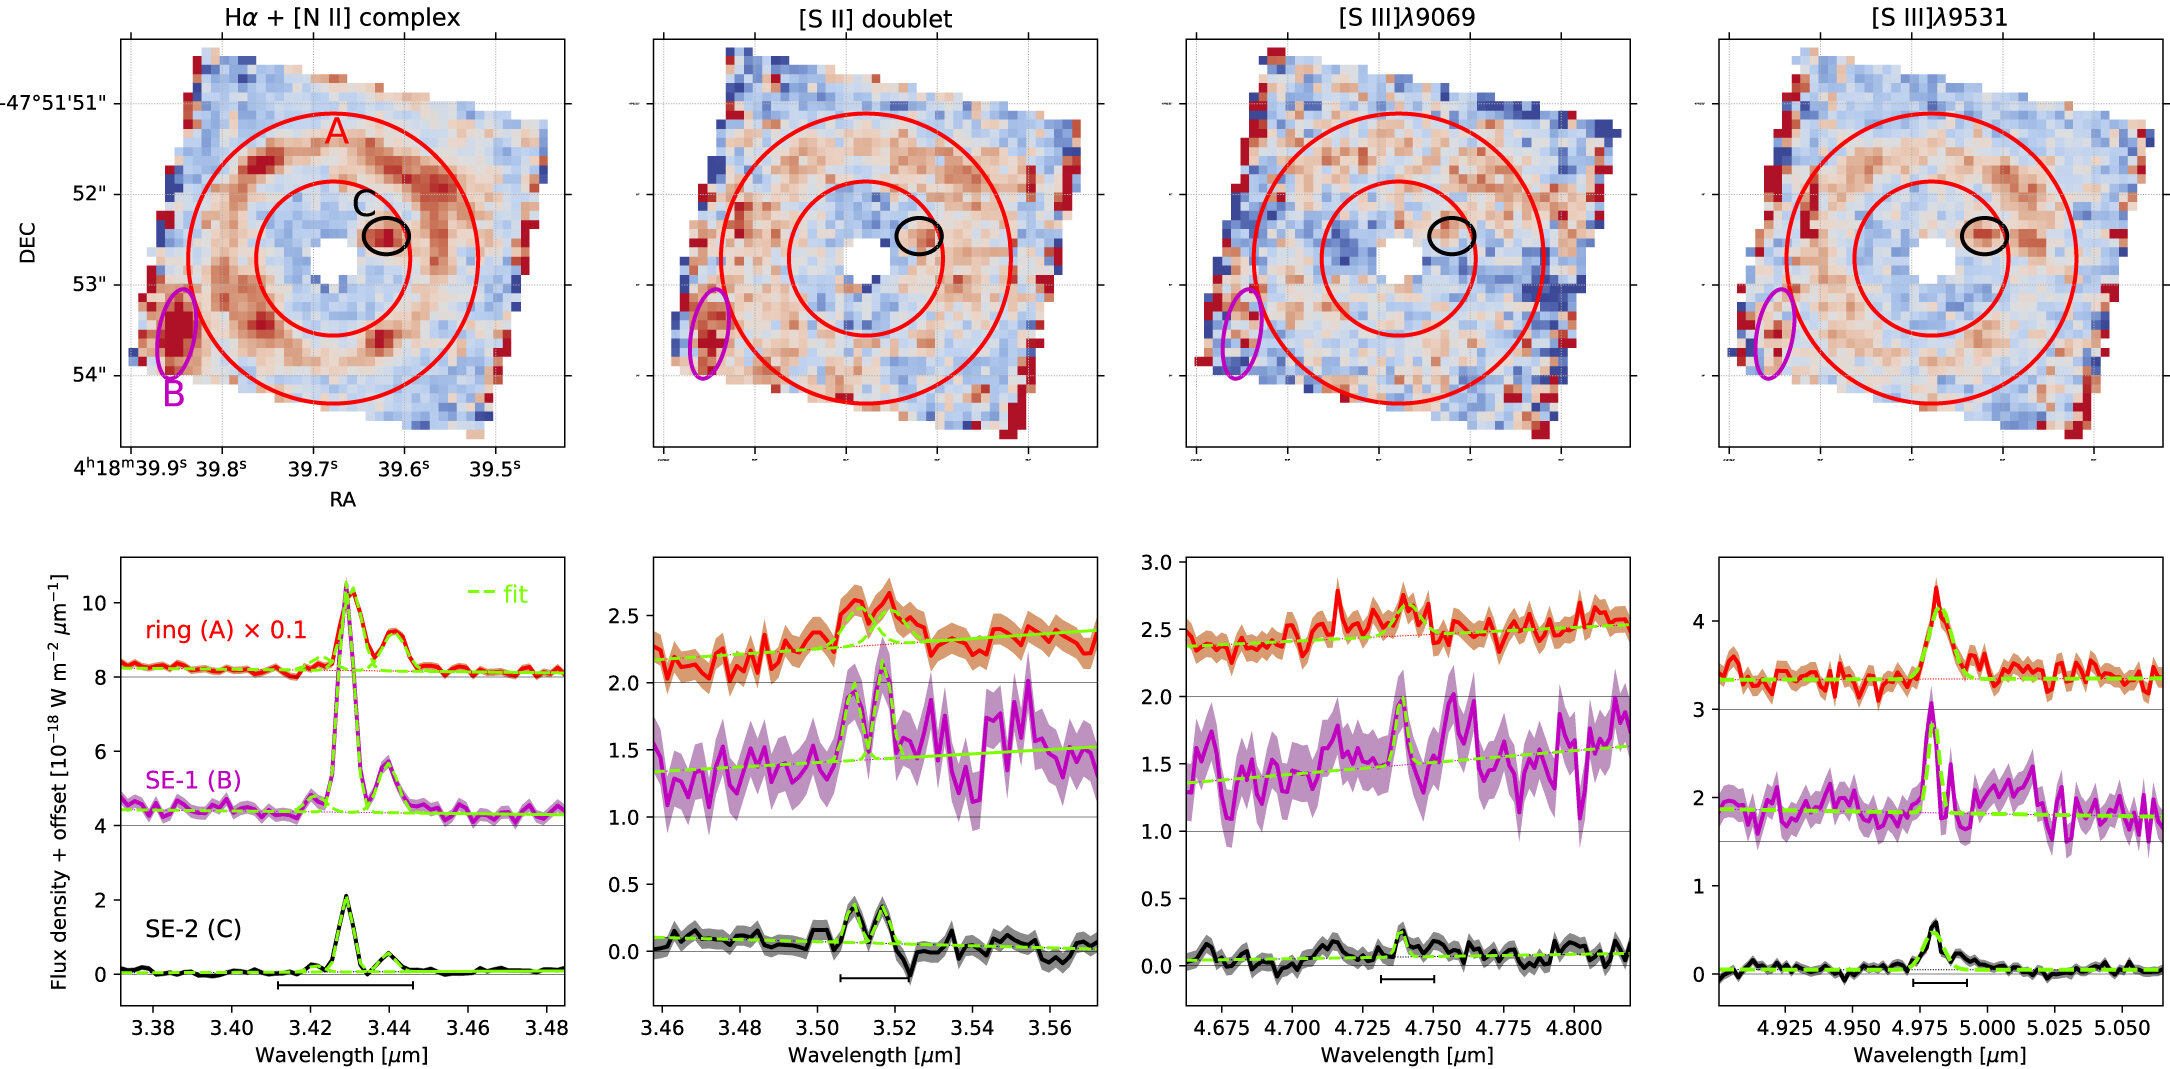
The moment 0 map and spectrum snippets of the strong emission lines. For each strong line(s), the lens-subtracted, continuum-subtracted moment 0 map is displayed in the first row, with the same marked regions as in Figure 1. The spectrum snippets are shown in the second row, integrated over the three regions. The spectra are offset vertically to aid vision, with the zero baseline indicated by a thin black line. The green dashed line indicates the Gaussian fit to the line or line associations plus the linear fit to the local continuum. The labeling style and color of the spectrum are the same as Figure 1. Credit: The Astrophysical Journal Letters (2023). DOI: 10.3847/2041-8213/acb59c
While analyzing data from the first images of a well-known early galaxy taken by NASA’s James Webb Space...


 Astronomy/Space

Recent Comments