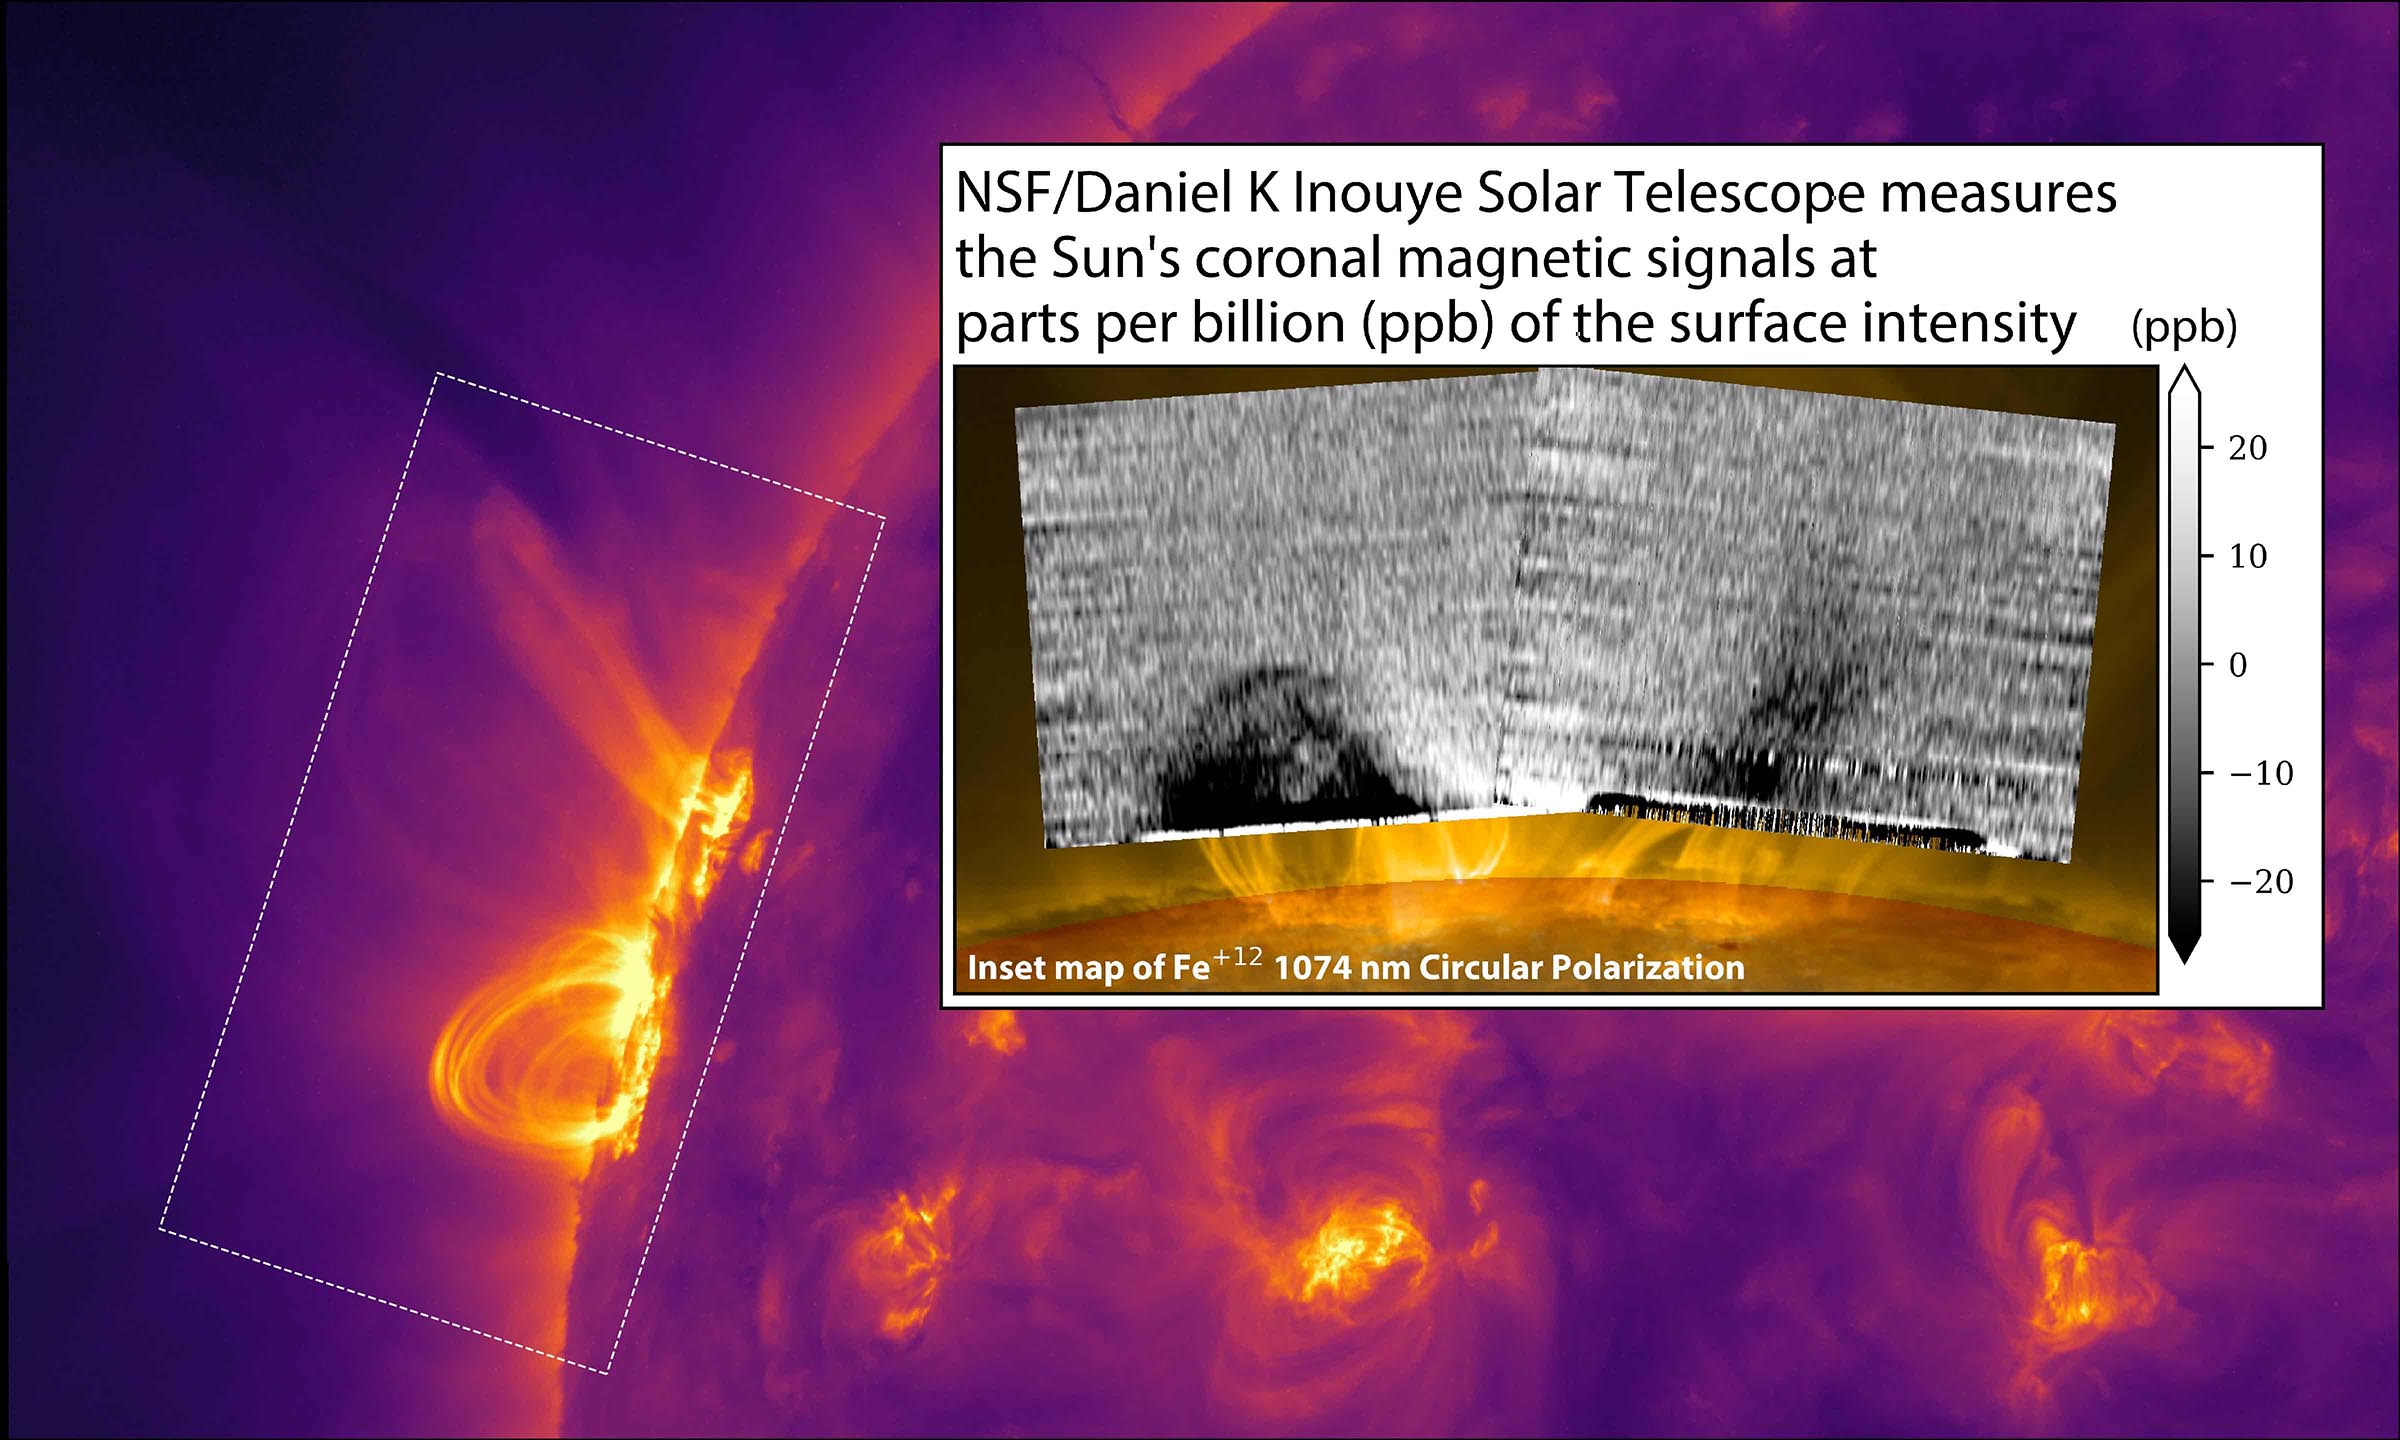
The U.S. National Science Foundation (NSF) Daniel K...
Read More

September 14, 2024,
 Astronomy/Space
The U.S. National Science Foundation (NSF) Daniel K...
Read More
May 9, 2016,
Astronomy/Space

About 80 solar cycles seen from the surface, i.e. more than 1,000 years in solar time, modelled by means of a computer simulation. At 20-50 years in simulation time, a simulated grand minimum occurs, which in actual fact is the maximum of magnetic energy. Credit: Image courtesy of Aalto University
The study of the Sun’s long-term variation over a millennium by means of super computer modelling showed that during a time period of the Maunder Minimum type, the magnetic field may hide at the bottom of the convection zone. The study seeks explanation for the mechanisms underlying the long-term variation in solar activity. The recently published study was carried out by running a global computer model of the Sun on Finland’s most powerful super computer over 6 months.
‘The Sun has an 11-year cy...
Read More

Recent Comments