A star is being consumed by a distant supermassive black hole. Astronomers call this a tidal disruption event (TDE). As the black hole rips apart the star, two jets of material moving with almost the speed of light are launched in opposite directions. One of the jets was aimed directly at Earth. Credit: Carl Knox (OzGrav, ARC Centre of Excellence for Gravitational Wave Discovery, Swinburne University of Technology)
Researchers have discovered that in the exotic conditions of the early universe, waves of gravity may have shaken space-time so hard that they spontaneously created radiation.
The physical concept of resonance surrounds us in everyday life. When you’re sitting on a swing and want to go higher, you naturally start pumping your legs back and forth...
This artist’s concept shows the brilliant glare of two quasars residing in the cores of two galaxies that are in the chaotic process of merging. The gravitational tug-of-war between the two galaxies ignites a firestorm of star birth. Quasars are brilliant beacons of intense light from the centers of distant galaxies. They are powered by supermassive black holes voraciously feeding on infalling matter. This feeding frenzy unleashes a torrent of radiation that can outshine the collective light of billions of stars in the host galaxy. In a few tens of millions of years, the black holes and their galaxies will merge, and so will the quasar pair, forming an even more massive black hole. Credits: NASA, ESA, Joseph Olmsted (STScI)
The early universe was a rambunctious place where galaxies ofte...
An artist’s conceptual rendering of interactions between a prospective exoplanet and its star. Plasma emitted from the star is deflected by the exoplanet’s magnetic field then interacts with the star’s magnetic field, resulting in an aurora on the star and the emission of radio waves. Credit: National Science Foundation/Alice Kitterman
Earth’s magnetic field does more than keep everyone’s compass needles pointed in the same direction. It also helps preserve Earth’s sliver of life-sustaining atmosphere by deflecting high energy particles and plasma regularly blasted out of the sun...
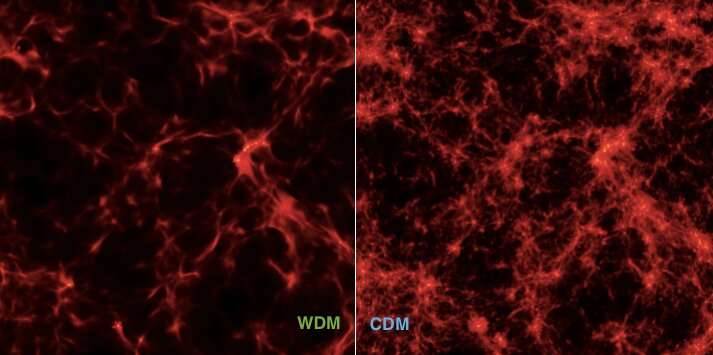
Distribution of primordial matter in cosmological models with hot dark matter (WDM, left) and cold dark matter. Credit: CDM, destra
Astrophysicists in Italy have shed new light on the nature of matter from the James Webb Space Telescope (JWST) detection of galaxies from 13 billion years ago and novel state-of-the-art numerical simulations of the first galaxies. The study adds another piece to the puzzle of the nature of matter in the universe.
While the commonly accepted paradigm of structure formation is based on non-relativistic matter that interacts only gravitationally, that is “cold” dark matter, alternative possibilities advocated to solve small-scale problems of the standard scenario rely on the hypothesis that dark matter is made of warm particles that possess a small, non-n...


Recent Comments